

Detecting Decision Drift with NLP
Making Invisible Decision Drift Visible Using Natural Language Processing

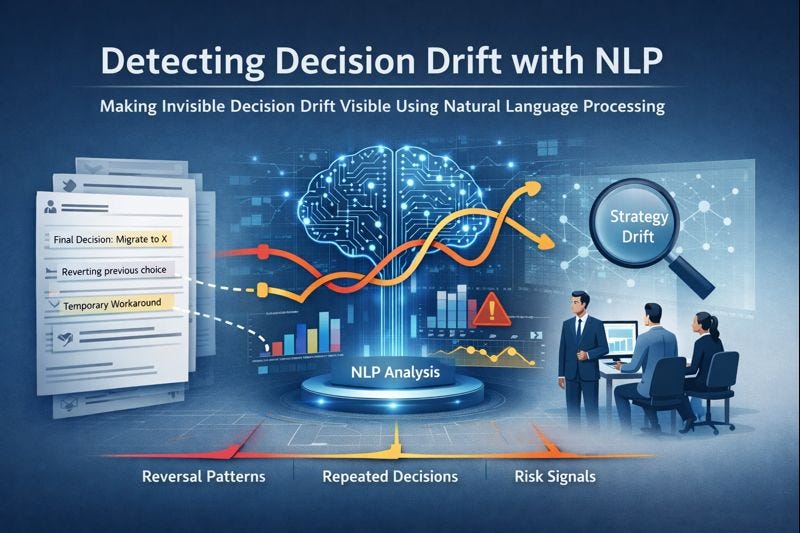
Most organizational failures are not caused by lack of data or effort, but by unexamined decisions that drift, repeat, or reverse over time. This project uses AI to analyze decision-related text across engineering and delivery systems, revealing patterns that are normally invisible to leadership. By making decision behavior measurable, it helps organizations detect strategic misalignment and governance gaps early — before they turn into cost, delay, or risk.
The problem we are trying to solve
In most organizations, strategy rarely fails in a dramatic or obvious way. Instead, it slowly weakens in subtle, hard-to-notice patterns. The same decisions keep resurfacing in meetings and tickets, earlier choices are quietly reversed without clear reasoning, and temporary shortcuts gradually turn into accepted behavior. Leaders often sense that something is wrong — teams feel busy, progress feels uneven — but they struggle to clearly explain what is causing the drift. Importantly, this breakdown happens before execution visibly fails. It begins earlier, when decisions are interpreted, simplified, and reshaped as they move through different layers of the organization. The real challenge is that these early warning signs don’t appear in metrics or dashboards. They live inside everyday text — Jira tickets, architecture decision records (ADRs), comments, and internal documents. This raises a critical question: can we automatically read organizational text and detect early signals of strategy drift before it becomes a visible failure? This project is built to answer exactly that question.
This essay is written for leaders, product managers, and platform teams who sense that alignment is weakening — but lack a way to observe or measure it early.
What this project does
This project reads decision-related text from Jira-like tickets and answers four simple questions:
Are we deciding the same thing again and again?
Have we reversed direction on any major decision?
Are teams regularly taking shortcuts that violate our own rules?
How risky does this pattern look overall?
To answer these, we built a small NLP pipeline in Python.
What is NLP?
NLP stands for Natural Language Processing.
In plain terms, NLP is how we teach computers to work with human language — sentences, meaning, intent. Computers don’t understand language like humans do, they only understand numbers.
So, NLP is about converting language into numbers without losing meaning.
You can find all the code and technical details HERE
Step 1 — Input: Jira-like decision data
Every organization already produces a huge amount of written information every day. Teams write Jira tickets, architecture decision records (ADRs), design notes, and comments. Inside all this text, important decisions are being made — often casually, often quickly, and often without realizing how long their impact will last.
Each Jira ticket usually contains:
a summary (a short description of what the ticket is about),
a description (more detailed explanation),
sometimes comments (follow-up discussion or clarification),
and dates showing when the ticket was created or updated.
For example, a ticket might say:
“Final decision: standardize on Kafka for event streaming.
Trade-off: this may slow feature delivery by one sprint.”
This is not programming code. This is decision language — humans explaining what they have decided, why they decided it, and what compromises they are making. Our project starts by taking this existing text exactly as it is. We are not asking teams to change how they work or write. We simply use the information that already exists inside the organization.
Step 2 — Finding “decision-like” tickets (explained simply)
Not every Jira ticket contains a decision.
Some tickets are about:
fixing a bug,
adjusting a UI label,
updating documentation,
or answering a small operational question.
If we mix these with real decisions, the analysis becomes noisy and meaningless. So, the first thing we do is separate decision tickets from non-decision tickets. To do this, we use a very simple idea, decisions tend to use certain words and phrases.
We scan ticket summaries and descriptions looking for words such as:
decision
we will
final approach
chosen
standardize
migrate
deprecate
ADR or RFC
If a ticket contains these kinds of phrases, it is very likely that someone is:
committing to a direction,
choosing between options,
or locking in a long-term approach.
This step answers a very basic but critical question:
“Which tickets actually contain decisions?”
At this stage, there is no AI, no machine learning, no complex logic. It is simply filtering — similar to highlighting important sentences in a document.
Think of it like this:
Step 1 collects all written conversations
Step 2 selects only the conversations where decisions are being made
Only after this do we move toward deeper analysis.
Step 3 — Creating a single “decision text”
In real life, decisions are rarely written in one clean sentence. Parts of the decision are spread across different fields.
For example:
The summary may say what was decided
The description may explain why
The comments may reveal doubts, pressure, or trade-offs
To make analysis easier, we combine these pieces into one block of text. In simple terms, we do this:
decision_text = summary + description + important comments
Example: How a decision is scattered
Jira Summary
Finalize event streaming approach
Jira Description
We will standardize on Kafka for all event-driven services.
This aligns with platform reliability goals.
Comments
Concern: this may slow feature delivery initially.
SRE team is aligned with the decision.
Individually, these pieces don’t tell the whole story.
We merge all relevant parts into one single piece of text, called decision_text.
Resulting decision_text
Finalize event streaming approach.
We will standardize on Kafka for all event-driven services.
This aligns with platform reliability goals.
Concern: this may slow feature delivery initially.
SRE team is aligned with the decision.
Now, instead of many fragments, each decision is represented as one complete piece of text.
This gives us a clear and consistent unit to work with in later steps.
Step 4 — Embeddings (explained in very simple terms)
This is the most important concept in the entire project, so let’s slow down here.
What is an embedding?
An embedding is a way to turn text into numbers without losing meaning.
Computers cannot understand sentences the way humans do.
They don’t understand intent, context, or similarity by default.
For example, these two sentences look different:
“We will standardize on Kafka”
“Kafka will be our default event system”
To a human, they clearly mean the same thing.
To a computer, they look completely different.
An embedding solves this problem.
It converts each sentence into a list of numbers in such a way that:
Sentences with similar meaning get similar numbers
Sentences with different meaning get very different numbers
So even if the wording changes, the meaning stays close.
Why embeddings matter
Without embeddings:
A computer only sees words
Slight wording changes look like completely new decisions
With embeddings:
A computer can recognize that two decisions are about the same idea
We can group similar decisions together
We can detect repetition and drift
An embedding looks like this (simplified):
[0.12, -0.88, 0.45, 0.91, -0.33, ...]
Example: Why embeddings are powerful
Sentence A
“We will standardize on Kafka for event streaming.”
Sentence B
“Kafka will be the default system for events.”
Different words.
Same meaning.
When converted to embeddings:
Their number lists are very close to each other
The computer understands they belong to the same idea
Sentence C
“We will bypass the API gateway for faster delivery.”
This sentence will have an embedding far away from A and B.
In this project, we use a pre-trained NLP model (from sentence-transformers).
“Pre-trained” simply means the model has already learned language patterns from a very large amount of text, so we don’t have to teach it from scratch.
This step is the heart of the system.
It is what allows us to move from raw text to meaningful analysis.
Step 5 — Clustering (grouping similar decisions)
Clustering is the process of grouping similar things together without telling the computer in advance what the groups should be. In this project, clustering helps us discover which decisions are actually about the same underlying topic, even if they are written differently or made by different teams at different times.
By this stage, every decision has already been converted into an embedding, which is a numerical representation of its meaning. This means:
Each decision becomes one set of numbers
Decisions that mean similar things have similar numbers
Clustering works by looking at these numbers and grouping decisions that are close to each other in meaning. For example:
All decisions related to Kafka or event streaming naturally fall into one cluster
All decisions related to API Gateway usage fall into another cluster
Decisions about reliability, SLOs, or error budgets may form their own group
The key point is that we never tell the system what these topics are. We do not label anything as “Kafka” or “Gateway” in advance. The system discovers these patterns on its own by analyzing meaning, not keywords.
This is powerful because it allows us to detect repeated decisions automatically. If a single cluster:
Contains many decisions
And those decisions are spread across weeks or months
then it means the organization keeps revisiting the same topic again and again. In real-world terms, this usually signals that a decision was made, but never fully landed across the organization.
Repeated clusters are one of the clearest early warnings that strategy is not sticking, even though teams may believe they are aligned.
Let’s say we have four decisions, already converted into embeddings:
Decision texts
“We will standardize on Kafka for event streaming”
“Kafka will be our default messaging system”
“All external traffic must go through the API Gateway”
“Expose services only via the gateway”
Their embeddings (imaginary numbers for explanation)
5. Decision 1 → [0.91, 0.12, 0.08]
6. Decision 2 → [0.89, 0.10, 0.11]
7. Decision 3 → [0.15, 0.88, 0.09]
8. Decision 4 → [0.14, 0.90, 0.07]
What the computer sees:
Decision 1 and 2 have very similar numbers
Decision 3 and 4 have very similar numbers
But the two groups are far apart from each other
Resulting clusters
Cluster A → Decisions 1 & 2 → Kafka-related
Cluster B → Decisions 3 & 4 → API Gateway-related
Again, the system was never told:
“This is Kafka”
“This is Gateway”
It simply grouped decisions based on numerical closeness, which represents semantic similarity.
How this reveals repeated decisions
Now imagine:
Cluster A (Kafka) has 6 decisions
They appear across 8 months
This tells us:
Kafka strategy keeps coming up
The organization is re-deciding, not just executing
This is not a delivery problem.
This is a decision-translation problem.
One-line takeaway for this step
Clustering turns scattered decision conversations into visible decision themes — making invisible strategy drift measurable.
Step 6 – Detecting Repeating Decisions
When a strategy decision is clear and well understood, teams don’t keep re-deciding it. They execute it. Repeated decisions occur when the same topic keeps resurfacing across months — not because new information emerged, but because the original intent was interpreted differently across teams.
For example, if “Kafka as the event backbone” is decided in January, it should not need to be decided again in March, June, and September. When it is, that signals that the decision never truly settled.
In this project, repeated decisions are detected when multiple decision texts cluster around the same topic over time. This is one of the earliest and strongest indicators of strategy drift — the organization is debating instead of building.
Step 7 — Detecting decision reversals
Once similar decisions have been grouped together into clusters, the next step is to look inside each cluster over time. At this point, we are no longer asking what topic this decision belongs to — we are asking whether the direction of thinking about that topic changed.
A decision reversal happens when an organization first moves towards a choice and later moves away from the same choice. For example, a team might decide in February to “adopt Kafka as the standard event system”, and then in September decide to “move off Kafka due to operational complexity”. This is not normal refinement or iteration. It is a direction flip — the organization has reversed its earlier intent.
To detect this automatically, we use simple language cues embedded in the decision text. Words like “adopt,” “standardize,” “use,” or “introduce” indicate movement towards something. Words like “remove,” “deprecate,” “replace,” or “move off” indicate movement away from something. Each decision inside a cluster is scanned for these cues and labeled with a basic stance: towards, away, or neutral.
Next, the decisions in that cluster are sorted by date, creating a timeline. If earlier decisions show a towards stance and later decisions show an away stance, the system flags this as a reversal. At that point, the computer is no longer just reading text — it is reconstructing how organizational intent evolved over time.
This is powerful because reversals rarely happen by accident. They often indicate pressure, confusion, competing interpretations, or loss of clarity as strategy moves through the organization. By turning text into a timeline of intent, this step exposes where strategy didn’t just drift — it changed direction without a clear strategic reset.
Step 8 — Detecting anti-patterns (bad shortcuts)
After understanding what decisions are being made and how those decisions change over time, the next question we ask is:
Are teams making decisions that knowingly break good practices?
These are called anti-patterns.
Anti-patterns are not random bugs or mistakes. They are well-known shortcuts that teams take when they are under pressure. For example:
Bypassing an API gateway to ship faster
Hardcoding secrets instead of using a secure vault
Using cron jobs to poll systems instead of proper event mechanisms
Making manual changes directly in production
Most teams already know these are not ideal choices. Yet they still happen — usually because deadlines are tight, priorities are unclear, or leadership intent feels distant.
So instead of judging teams, this step tries to observe pressure.
To detect these anti-patterns, we create a simple rulebook. Each rule represents one known bad practice and contains a few keywords that typically appear when that shortcut is discussed. For example:
If a decision mentions phrases like “bypass gateway” or “direct service exposure”, it may indicate an API-gateway anti-pattern.
If it mentions “hardcoded token” or “API key in code”, it may indicate a security shortcut.
The system then scans each decision’s text and checks whether any of these rule keywords appear. If they do, that decision is flagged as an anti-pattern hit.
What this tells us is not:
“The team did something wrong.”
What it tells us instead is:
“At this point, teams felt enough pressure to trade long-term intent for short-term safety.”
When many such anti-patterns appear across decisions, it signals that strategy clarity is weakening. Teams are no longer confidently following the intended direction — they are improvising to survive.
This is how invisible pressure becomes visible through text.
Please note that, this system does not judge people, rank teams, or enforce decisions. It looks only for patterns across time and text. The goal is awareness, not control. And this system cannot understand context perfectly. It does not know whether a reversal was justified. It only surfaces patterns that deserve human attention.
Step 9 - Calculating Decision Debt Index (DDI)
What is the Decision Debt Index (DDI)?
The Decision Debt Index (DDI) is a simple number that tells us how unhealthy decision-making has become inside an organization. Just like technical debt builds up when teams take shortcuts in code, decision debt builds up when teams take shortcuts in decisions.
Decision debt forms when:
the same decisions keep coming back,
earlier decisions quietly get reversed,
and temporary exceptions slowly become normal behavior.
Individually, these moments don’t look dangerous. Together, over time, they weaken clarity, alignment, and execution. DDI exists to answer one simple leadership question: “Are we drifting — or are we still aligned?”
How is DDI calculated? (conceptually)
DDI is not a complex mathematical formula. It is a weighted summary of three signals we already detect from text.
DDI combines:
Repeated decision topics
→ How many times the organization is re-deciding the same thing
(a sign that decisions are not sticking)Decision reversals
→ How many times the organization changed direction
(a sign of confusion, pressure, or loss of intent)Anti-pattern hits
→ How often teams took known shortcuts
(a sign that long-term intent is being traded for short-term safety)
In simple terms, more repetition + more reversals + more shortcuts = higher DDI
Reversals matter more than repetition. Shortcuts matter, but they are scaled so one bad week doesn’t distort everything. The goal is signal, not precision.
How to read DDI (human interpretation)
DDI is meant to be read like a health indicator, not a scorecard.
DDI 0–2
→ Healthy decision-making
→ Strategy is landing and stickingDDI 2–4
→ Early drift
→ Some misalignment, but still recoverableDDI 4–6
→ Active decision debt forming
→ Strategy erosion has startedDDI 6+
→ High decision debt
→ Execution issues are likely to follow
Conclusion
You don’t need AI to make teams work faster. You need AI to help leaders see what they are already missing.
This project proves that:
Strategy can leave measurable signals in written decisions
Repeated and drifting decisions create real organizational debt
Leadership blind spots can be identified long before they turn into failures
That is what Arcaence is about, turning hidden decision patterns into visible insight — so organizations can correct course before cost, delay, or damage sets in.