

Latency Debt: The Hidden Cost Lurking in Platform Integrations
Why speed-to-market hides a compounding drag on scalability, experience, and valuation.

It often begins quietly — a small message in a team chat: “API response seems a little slower today.” No outage. No alarm. Nothing broken. Just a subtle sense that the system isn’t quite as fast as it used to be. Everything still works, but it feels heavier, slower, slightly less alive.
This is how latency debt begins — not with a failure, but with a feeling.
When platforms scale fast, their slowdowns rarely start in code. They begin in decisions. A release approval that takes longer than planned. A quick patch shipped before understanding its full impact. A dependency blocked by another team’s backlog. Each of these moments feels minor, but together they create invisible friction — not in servers, but in coordination.
Over time, that friction accumulates. A one-day delay in approval becomes a 200-millisecond lag in production. Multiply that across hundreds of APIs and millions of requests, and you get a platform that works perfectly — but feels tired. Nothing is technically wrong. Yet performance, once effortless, has quietly decayed. quietly decayed.
WHAT is happening ?
What’s building up here isn’t just technical debt; it’s latency debt — the hidden drag created when organizations prioritize speed today over flow tomorrow. Technical debt is easy to see: bad code, skipped tests, missing documentation. Latency debt is invisible. It hides in dependencies, coordination overhead, and decisions made under pressure.
It’s not about how fast each system runs — it’s about how smoothly they work together. Every new integration, patch, or connection adds a little resistance. The problem isn’t the milliseconds themselves; it’s how they multiply. A hundred tiny frictions across the stack combine into a feeling that everything takes longer than it should.
Think of it like this: every new app you install on your phone adds one second to its startup time. Each app works fine. But after fifty, your phone boots almost a minute slower — not because it’s broken, but because it’s burdened. That’s what latency debt does to platforms. Growth adds power — and gravity.
At first, teams see it as the cost of success. “The platform’s just bigger now,” someone says. But slowly, those micro-delays become cultural. Everyone accepts that things are “a bit slower,” that pipelines “just take longer now.” And because nothing seems broken, no one investigates what’s compounding beneath the surface.
WHY its happening ?
The Hidden Equation
Latency debt doesn’t show up in dashboards. It lives between them.
A typical API call that once took 200 milliseconds might now take 1.2 seconds — not because of one bad service, but because the request now crosses ten teams’ boundaries. Each adds authentication, logging, monitoring, caching, and retries. Each layer works correctly; together, they create delay.
Once you see latency as an emergent property rather than a defect, its growth becomes predictable:
Latency Debt = Integration Volume × Invisible Dependencies × Lack of Ownership.
As integrations multiply, ownership blurs. The architecture scales, but responsibility fragments. Everyone owns a part, and therefore no one owns the whole. The system runs — but responsiveness, the one metric users feel directly, has no steward.
The Cultural Root
If latency debt were purely technical, it would be easy to fix. We have tools for code: profilers, logs, tracing, observability dashboards. But latency debt begins long before it hits production — in how teams think, how urgency is rewarded, and how awareness decays.
The real slowdown starts in culture. Speed-to-market feels like progress, and every team wants to move fast. But speed without depth is an illusion. Each “quick win” taken without reflection quietly mortgages future velocity. Over time, the organization’s ability to move fast doesn’t vanish — it’s just harder to feel.
Consider what happens during a major product launch. A new API is patched for a demo. It works flawlessly. Weeks later, that temporary fix becomes a permanent dependency. It doesn’t break the system — it just adds weight. The next release inherits that drag, and so does the next. Teams stop asking why things take longer; they simply adapt.
That’s how slowness becomes culture. A nightly job that once ended at 4 a.m. now finishes at 8, but reports are published later, so no one notices. SLAs stretch. “Acceptable latency” quietly redefines itself. New hires assume this is normal because they never saw the system when it was fast. The organization forgets what speed ever felt like.
Latency debt doesn’t grow because teams are careless — it grows because they’re rewarded for the wrong things. We celebrate releases, not refinements; features shipped, not friction removed. We measure motion, not flow. The more we chase visible progress, the more invisible drag accumulates.
The Blind Spot
Latency debt hides behind metrics that look good. Dashboards show 99.9% uptime. Error rates are flat. The deployment pipeline is green. Everything appears fine. Yet users feel the difference — a dashboard that takes longer to load, a payment flow that feels heavier, a support interaction that begins with “It’s working, just slower than before.”
That’s the paradox: latency debt doesn’t break things; it erodes their sharpness. The tools we use to measure success can’t detect it because they track what’s visible (availability, throughput) but ignore what’s felt (responsiveness, clarity). The human brain notices delays long before systems do. By the time logs confirm a slowdown, user trust has already begun to fade.
And so organizations start optimizing the wrong problem. They buy more servers, add more caching, and scale horizontally — anything except awareness. They add horsepower to a system whose real issue is drag.
Latency as Leadership
The best companies treat latency as leadership. Amazon, Google, Netflix — each measures speed not just in code, but in cognition. They ask, “Does it feel instant?” rather than “Does it meet the SLA?” Because they know latency isn’t a number; it’s a mirror reflecting how aligned their teams are.
Latency debt grows fastest when awareness decays. Every unclear dependency, every delayed approval, every “let’s revisit next sprint” adds invisible drag that later hardens into real system latency. The minutes lost in meetings reappear as milliseconds in production. Decision latency becomes system latency.
That’s why latency debt is cultural before it is technical. It begins in how organizations decide, not how they deploy. Observability tools can measure execution lag, but not indecision, not ownership decay, not cognitive drag. Those exist in the human layer — and that’s where the real slowdown begins.
The Future of Latency Debt — The Inevitable Gravity Ahead
Latency debt isn’t just a current problem; it’s a preview of what will define platforms in the next five years. Three major shifts — all nearly certain — will make it impossible to ignore.
1. API Overload and the Dependency Explosion
Modern products connect to everything: payment gateways, analytics tools, AI models, compliance APIs, third-party identity systems. Each connection feels small, but every new handshake adds complexity and delay. Today’s system with 20 APIs may have 200 in five years. When one slows, everything waits.
This is dependency debt — the hidden cost of being connected to too many systems. It’s not poor engineering; it’s the natural consequence of integration sprawl. Without deliberate latency hygiene, future platforms will feel like traffic jams — perfectly functional yet perpetually waiting. The systems that stay fast will be those that measure and prune connections, not just add them.
2. Predictive Load and “Thinking Lag”
AI is becoming embedded in every user flow — predicting, recommending, approving, blocking. Each prediction takes time. Models call models, data moves across layers, and milliseconds vanish in inference. Even with faster chips, coordination between algorithms creates what we might call cognitive latency — the time it takes for a system to make up its mind.
Tomorrow’s bottlenecks won’t just be slow APIs or databases; they’ll be slow decisions. Platforms that rely on machine reasoning will develop “thinking lag,” where intelligent systems hesitate just long enough for users to notice. Managing cognitive latency will become as critical as managing infrastructure latency today.
3. Decision Fatigue and Leadership Slowdown
As systems grow more complex, leaders will face more data, more dashboards, and more conflicting metrics. The real risk isn’t technical — it’s psychological. The delay won’t be in response time; it will be in decision time.
This is leadership latency — the gap between seeing an issue and acting on it. When organizations drown in signals, they start reacting to symptoms instead of causes. Meetings multiply, clarity decays, and speed of thought — once a company’s greatest strength — turns into its biggest bottleneck.
Together, these three forces — API overload, cognitive latency, and leadership slowdown — will redefine what speed means. The next era of platforms won’t collapse from failure; they’ll stall from friction.
Designing for the Future
To stay ahead, organizations will need to treat latency debt as a design principle, not a post-mortem metric. The question is no longer “How do we scale?” but “How do we scale without slowing down?”
The answer lies in systems awareness — mapping dependencies before they multiply, measuring coordination cost alongside performance cost, and treating latency as an indicator of organizational health.
Platforms that do this will feel light no matter how large they grow.
They will sense friction before it becomes drag. And they will move fast — not because they chase speed, but because they preserve coherence.
The Real Lesson
Latency Debt is the hidden tax on momentum — the performance drag created whenever organizations mistake speed for progress. It’s not a bug in systems; it’s a mirror for culture. The next generation of great platforms will not just process faster — they will think faster, decide faster, and feel faster to the people who use them.
Because the future of speed isn’t about milliseconds. It’s about how little friction exists between intention and impact.
HOW can we handle it ?
Understanding latency debt is only half the battle. The real challenge is transforming that awareness into measurable control. This section introduces a set of frameworks and instruments that convert invisible friction into quantifiable metrics — tools any platform team can use to see, measure, and govern their latency debt before it compounds.
1. Latency Ledger Framework
What It Is
Latency debt hides because no one “owns” the milliseconds. Each team looks only at their slice — their API, their service, their deployment. But users don’t experience latency locally; they feel it cumulatively. The Latency Ledger solves that invisibility problem. It is a central accounting system for latency — a shared document or dashboard where every team logs, tracks, and owns the latency they introduce to the overall platform experience. Just like finance teams track expenses across departments, the Latency Ledger tracks performance cost across integrations, features, and dependencies.
It converts performance from an engineering issue into a systemic accountability mechanism.
How It Helps Solve the Issue
When platforms scale fast, each new API adds small, almost invisible friction. Individually, 30 or 40 milliseconds mean nothing. Collectively, across 50+ APIs and 10+ services, they can add hundreds of milliseconds to every transaction.
When platforms scale fast, each new API adds small, almost invisible friction. Individually, 30 or 40 milliseconds mean nothing. Collectively, across 50+ APIs and 10+ services, they can add hundreds of milliseconds to every transaction.
The Latency Ledger forces teams to:
See the invisible — by exposing how much latency each part of the system adds.
Quantify trade-offs — teams realize that every quick patch or integration has a performance cost.
Balance priorities — a product manager can now ask:
“If we add this new analytics call, are we still within our latency budget?”
Drive shared accountability — latency stops being “Ops’ problem” and becomes a collective responsibility.
Once the ledger exists, latency becomes visible, measurable, and governable — exactly like financial debt.
Teams begin treating performance as currency — something to be budgeted, not just optimized after the fact.
How It Works — Step-by-Step
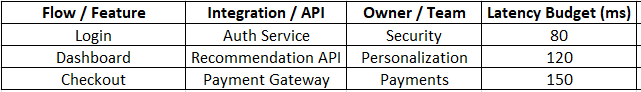
Step 1: Create the Ledger Table
Start with a simple shared sheet or dashboard with the following columns:

This becomes your “Performance Ledger.”
Each team adds their API or service, along with real observed latency and variance values from monitoring tools
Step 2: Set a “Latency Budget”
Every core user flow (login, checkout, dashboard load, etc.) should have a target latency budget — e.g., 500 ms total. Then distribute this budget across components based on business priority.
Step 3: Identify “High-Interest Latency”
Some APIs or integrations have volatile latency — they spike unpredictably due to dependency chains or external calls. In the Ledger, mark these as “High Interest” entries (akin to high-interest loans).
Example:
The third-party Recommendation API takes 150 ms on average but sometimes spikes to 600 ms during peak hours. That volatility means it’s eroding user experience in unpredictable ways — a classic symptom of latency debt compounding.
Step 4: Review It Periodically
Run Latency Ledger Reviews just like sprint retrospectives or budget reviews.
Each team answers:
Are we within our latency budget?
Which APIs are trending upward in response time?
What technical or decision-related factors caused this drift?
The ledger then becomes both a visibility dashboard and a decision discipline tool — it trains leaders to think in trade-offs, not just tickets.
Detailed Example — How It Looks in Practice

excel template attached at the end (Arcaence Latency Debt Toolkit Link)
Terminologies Explained
Latency Ledger : A shared dashboard that records latency across services
Latency Budget : The total time budget allowed for a given flow
Variance : The fluctuation of latency from average
High-Interest Latency : APIs that spike or fluctuate heavily
Latency Review : Periodic analysis of ledger data
Closing Thought
The Latency Ledger doesn’t just measure milliseconds. It measures awareness. Once you can see where your time goes, you can decide where your speed should come from.
2. API Heat Index (AHI) Framework
What it is
The API Heat Index (AHI) is a simple but powerful framework that helps teams see which APIs are quietly slowing down user experience the most.
Every system has hundreds of APIs. Some are called hundreds of times a minute; others only once a day. But most teams treat them equally when reviewing latency — a mistake that causes misplaced effort.
AHI combines two critical factors:
How often an API is used (frequency)
How slow it is for users (latency)
It then assigns each API a “heat score”, showing where optimization will have the biggest impact on perceived speed.
In essence the AHI turns raw latency data into a visual heatmap of user impact.
The Problem It Solves
Without AHI, teams often optimize based on technical curiosity instead of user experience.
They fix APIs that look slow in logs but have negligible user impact — wasting weeks improving something users never notice, while the true bottlenecks remain untouched.
This misalignment leads to:
Misplaced optimization effort — fixing cold spots instead of hot spots
Diminishing returns — each improvement delivers less perceived speed
Latency debt growth — because small but frequent delays compound invisibly
AHI solves this by identifying which APIs cause the most felt slowdown — the kind users actually experience — and prioritizes them.
How the Problem Is Solved
The API Heat Index works by weighting latency with usage frequency and user visibility.
The logic is simple:
The more an API is called and the slower it is, the hotter it becomes.
The AHI formula (simplified) is:
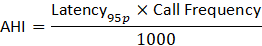
Latency is in milliseconds, and frequency is dimensionless (number of calls).
If you divide by 1000, you essentially convert milliseconds into seconds-equivalent weight, so your numbers reflect a normalized scale rather than absolute time.
Where:
Latency₉₅p = 95th percentile latency (worst-case user experience)
Call Frequency = Number of calls per user session or per minute
The result is a relative heat score — higher means greater impact on perceived speed. You can visualize it as a heatmap where each API lights up according to its score.
Then:
APIs with high AHI → prioritize for optimization
APIs with medium AHI → monitor regularly
APIs with low AHI → defer optimization until critical
This ensures that every performance improvement aligns with actual experience value.
Detailed Example
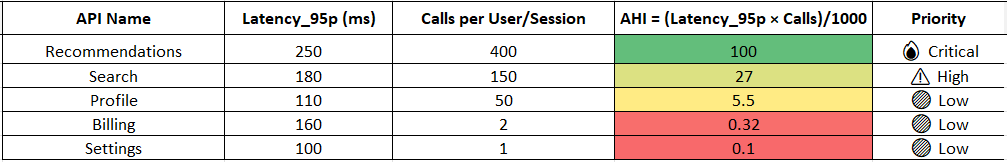
excel template attached at the end (Arcaence Latency Debt Toolkit Link)
Interpretation:
Recommendations API contributes most to “felt slowness” (users hit it 400× per session).
Billing and Settings APIs, while slower on paper, barely affect experience.
By improving just the Recommendations API latency from 250 ms → 150 ms, the overall experience improves more than optimizing all other APIs combined.
Terminologies Explained
Latency_95p (95th Percentile) : Measures the slowest 5% of requests — reflects worst-case user experience.
Call Frequency : Number of API calls made per user session or minute
AHI (API Heat Index) : Weighted score showing which APIs “burn hottest” in terms of user impact
Closing Thoughts
Most teams chase the slowest API; the best teams chase the most felt one.
The API Heat Index teaches you to think like your user, not your dashboard.
When you map your APIs by frequency × latency, patterns emerge — you’ll realize that 20% of your APIs create 80% of the performance drag. That’s where true optimization lives. Speed doesn’t come from fixing everything; it comes from fixing what matters most. The AHI turns performance from a guessing game into a precision instrument.
3. Integration Hygiene Index (IHI) Framework
What is it
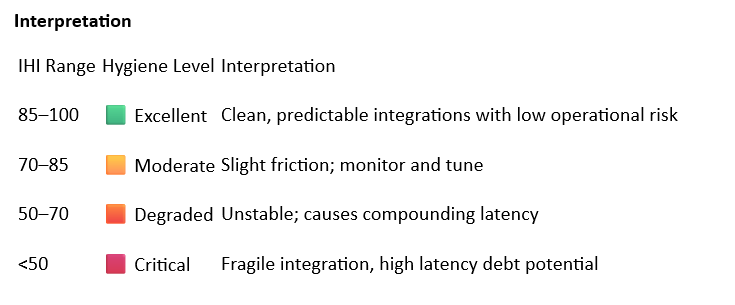
The Integration Hygiene Index (IHI) measures how healthy and predictable your integrations are — across APIs, microservices, and external systems.
Every integration behaves like a living system: it can be stable, flaky, or erratic depending on how it’s maintained. When integrations degrade silently (with retries, timeouts, inconsistent responses), they create “micro-frictions” that add up — turning performance smoothness into unpredictability.
IHI provides a single, numeric score (0–100) that reflects the stability, consistency, and resilience of every integration in your platform. Think of it as a “health score” — the cleaner your integrations, the higher your IHI, the smoother your user experience.
In essence: IHI turns invisible operational instability into a measurable system hygiene metric.
The Problem It Solves
As systems grow, integrations multiply — and with them, so does invisible fragility. You may have dozens of APIs and connectors working “fine,” yet performance varies wildly hour to hour.
The problem isn’t failure — it’s inconsistency.
Symptoms of poor integration hygiene:
Random response spikes or variance even when infrastructure is stable.
“Retry storms” that inflate latency during load.
Services that pass QA but degrade in production.
Growing operational noise — intermittent timeouts, transient 5xx errors.
Without a way to measure this hidden instability, teams misinterpret symptoms as network or infrastructure issues. That’s how latency debt hides and grows — not through outages, but through micro-friction.
The IHI Framework quantifies this hidden instability and helps prioritize where to intervene.
How the Problem Is Solved
The Integration Hygiene Index (IHI) solves the problem of invisible instability by turning raw integration signals — variance, error rate, and retry ratio — into a unified cleanliness score.
The key principle:
Don’t measure speed, measure stability of speed.
Each integration’s IHI is calculated by quantifying how close it is to the worst-performing integration in the system.
This relative comparison makes the metric fair, comparable, and scalable.
Step-by-step logic:
Normalize Each Metric (0–100 Scale):
For each API, we divide its metric by the maximum value seen among all integrations and multiply by 100.Variance Score (V) = (Variance ÷ Max Variance) × 100
Error Score (E) = (Error Rate ÷ Max Error Rate) × 100
Retry Score (R) = (Retry Ratio ÷ Max Retry Ratio) × 100
This expresses how unstable each API is relative to the worst one.
Weight the Signals:
Each factor contributes differently to hygiene.Variance (V): 40% weight (affects perceived smoothness)
Error Rate (E): 40% weight (affects reliability)
Retry Ratio (R): 20% weight (affects resilience)
Calculate Weighted Instability:

Derive Hygiene (Invert Instability):
Since high instability means poor hygiene, subtract it from 100:

This transforms “instability” into “health.”
A higher IHI means the integration is predictable, consistent, and less likely to cause latency debt over time.
Detailed Example

excel template attached at the end (Arcaence Latency Debt Toolkit Link)
Normalized V = (Var/80)×100
Normalized E = (Err/2)×100
Normalized R = (Retry/0.5)×100
Terminologies Explained
IHI (Integration Hygiene Index) : Composite health score of an API or service
Latency Variance (ΔL) : Range of deviation from average latency
Error Rate (E%) : Percentage of failed API calls
Retry Ratio (R) : Average retries per request
Hygiene Score : Weighted summary (0–100) of all three metrics
Closing Thoughts
Integrations are like arteries — clean ones keep data flowing, clogged ones slow the system down. The Integration Hygiene Index forces platforms to move beyond “Is it up?” to “Is it consistent?” Because users don’t care about uptime — they care about smoothness. By measuring variance, error, and retry friction, IHI gives leaders a single lens into system reliability health.
A high IHI means your systems are not just alive, but in shape. When you maintain integration hygiene, latency debt stops compounding — and platforms start aging gracefully.
The Interconnection of Latency Ledger, AHI, and IHI

The Future Impact Frameworks
As platforms evolve, speed will no longer be defined by infrastructure — but by how intelligently systems anticipate, adapt, and decide. The following frameworks explore the next frontier of latency: where performance meets prediction, and where cognitive and architectural drag become measurable forces. Each model helps leaders design platforms that don’t just run faster today, but stay fast as complexity, AI, and decision layers multiply.
1. Dependency Gravity Index (DGI) Framework
What this framework is
The Dependency Gravity Index (DGI) measures how “heavy” your platform has become — how tightly coupled, interdependent, and slowed down it is by the number of systems it relies on.
Every new API, vendor integration, or microservice adds gravitational pull to your platform. The more dependencies you attach, the harder it becomes to move quickly — like a planet that grows in mass and struggles to orbit freely.
DGI quantifies this architectural drag. It helps you see when “growth” has turned into “gravitational slowdown.”While latency debt hides in milliseconds, dependency debt hides in architecture — and the DGI makes that invisible mass measurable.
The Problem It Solves
Modern platforms scale through connections — not monoliths.
But every connection, library, and data handshake quietly increases coupling.
Soon, deploying one feature means waiting for three upstream approvals, two downstream tests, and one third-party SLA confirmation.
This causes three types of hidden friction:
Coordination drag — multiple teams must align before a change can go live.
Cascading risk — one failing dependency delays the entire chain.
Innovation freeze — fear of breaking integrations slows experimentation.
Even though the system “works,” the organization’s ability to change slows down. You’ve entered gravitational debt — the stage where architecture dictates decision velocity. The DGI framework exposes how this architectural weight accumulates, before it collapses your agility.
How the Problem Is Solved
The Dependency Gravity Index (DGI) expresses total architectural heaviness through a ratio of external dependencies to internal control units (services you own). It measures how many “foreign bodies” orbit your platform and how much they slow your motion.
The simplified formula is:

Where:
External Integrations = Number of 3rd-party APIs, SDKs, or services your system calls.
Average Latency per Integration = Mean time taken per call to these external services.
Internal Service Count = Number of self-owned APIs or modules in your architecture.
Interpretation:
Higher DGI → heavier platform (more dependency drag, slower movement).
Lower DGI → lighter platform (more self-sufficient, adaptable).
You can optionally add weights for critical dependencies (like payment, auth, or security APIs) to reflect real-world impact.


excel template attached at the end (Arcaence Latency Debt Toolkit Link)
Terminologies Explained
Dependency Gravity Index (DGI) : Composite measure of dependency drag — architectural heaviness
External Integrations : APIs, SDKs, or third-party connectors your system relies on
Average Latency per Integration : Mean time per external API call
Internal Service Count : Number of modules you own internally
Dependency Drag : Friction from external connections and inter-team coupling
Closing Thoughts
Every integration adds convenience — and gravity. The more dependencies orbit your platform, the slower your ability to change orbit. The Dependency Gravity Index is not about avoiding integrations; it’s about knowing when the architecture’s mass starts warping agility. It gives leaders a measurable early warning: when innovation velocity begins to decline not because of bad code, but because of too much gravity.
A healthy platform keeps its DGI < 200 — light enough to pivot, but dense enough to stay stable. Anything beyond that, and every release, every experiment, every idea takes longer to escape its own pull. In the end, agility isn’t lost in code — it’s lost in orbit. The DGI helps you spot that orbit decay long before your platform stops moving.
2. Cognitive Latency Index (CLI)
The Cognitive Latency Index (CLI) measures how much of your platform’s total response time is consumed by thinking — model inference, data fetching, synchronization, and orchestration between AI or ML components.
In the past, latency meant slow servers or APIs. Now, even with fast infrastructure, delays hide in “thinking systems” — algorithms that pause for predictions, scoring, and validation before returning results.
CLI brings visibility to this invisible “brain lag.” It answers a critical new performance question - How much time does your platform spend thinking before responding?
What Problem This Solves
As AI-driven features multiply — recommendation systems, fraud checks, personalization, anomaly detection — every workflow gains a cognitive layer.
Each of these adds milliseconds of invisible delay, which gradually stacks up into noticeable friction.
Symptoms include:
A “smart” search that feels slower than a basic one.
A checkout flow that pauses for a risk-score before approving payment.
An onboarding process that takes seconds longer as models validate user data.
Over time, the system starts to feel slower, even though the backend and APIs are healthy. CLI helps teams uncover this silent drag before it reaches users.
How the Problem Is Solved
CLI reframes latency as a thinking budget.
Core idea: Every system has a finite response-time budget.
Just as engineers allocate milliseconds to APIs, they must now allocate “thinking milliseconds” to AI pipelines.
By measuring and monitoring CLI, teams can:
Quantify how much time is spent in inference and model coordination.
Compare “thinking time” across different workflows.
Identify when AI overhead grows faster than user-perceived value.
This shifts optimization from “add more models” → to “make models think smarter, faster, and only when needed.”


excel template attached at the end (Arcaence Latency Debt Toolkit Link)
Terminology Explained
Model Inference Time : Time the ML model spends generating output after receiving input.
Data Fetch Time : Time taken to collect, transform, or retrieve data inputs needed by the model.
Sync Delay : Coordination lag between multiple models or data sources, including network waits.
Total Response Time : The full time from a user’s request to a system’s response — includes compute, network, and prediction.
Predictive Budget : A pre-defined time limit (e.g., 200 ms) allocated for AI inference in a critical flow.
Closing Thoughts
The Cognitive Latency Index transforms AI performance from mystery to metric. It turns “How smart are we?” into “How efficiently do we think?”
Every model that predicts should also prove its speed. In the next decade, platform performance will depend less on how much AI it uses, and more on how little time AI takes to decide. Tracking CLI ensures intelligence enhances experience — instead of slowing it down.
3. Decision Velocity Index (DVI)
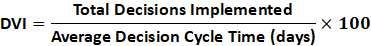
The Decision Velocity Index (DVI) measures how quickly an organization converts data into decisions and decisions into deployments.
While traditional latency frameworks measure technical delays, DVI quantifies cognitive and organizational latency — the time it takes for a decision to travel from recognition to action.
It answers: How fast does our organization make and implement good decisions — repeatedly?
DVI connects business strategy with platform agility. When DVI falls, it’s not technology that slows down first — it’s thinking, alignment, and ownership.
What Problem This Will Solve
Modern platforms don’t fail because of code; they fail because of decision drag:
Too many approvals for small changes.
Long wait times between identifying a problem and acting on it.
Teams overloaded with metrics but lacking clarity.
Decision cycles that expand faster than deployment cycles.
As organizations scale, the number of decision layers grows exponentially — creating Decision Latency, the invisible tax on innovation. The DVI framework exposes and quantifies that latency.
How the Problem Is Solved
The DVI framework reframes decision-making as a flow metric, not a leadership art. It breaks down decisions into measurable steps — from recognition to release — and assigns time weights to each.
By analyzing these stages, you can pinpoint where decision friction accumulates:
Recognition → misalignment between monitoring and ownership
Evaluation → over-analysis or unclear accountability
Approval → hierarchical bottlenecks
Action → execution friction or unclear success metrics
Once measured, DVI acts like a mirror. Teams can shorten loops, delegate autonomy, automate approvals, and establish clear “decision SLAs.”
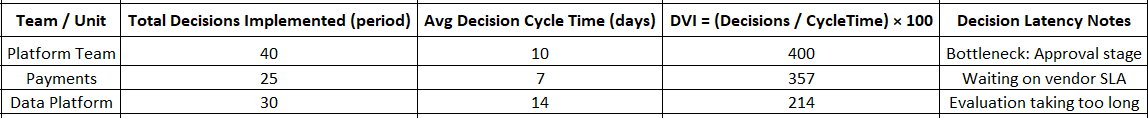
excel template attached at the end (Arcaence Latency Debt Toolkit Link)
Closing Thoughts
The Decision Velocity Index bridges the gap between strategy and execution speed. It turns leadership agility into a quantifiable, improvable variable — much like code latency or API response time.
Every millisecond you save in system latency is wasted if your decisions take weeks. DVI makes decision speed a first-class citizen of performance.
In future-facing organizations, latency debt and decision debt are twins — one technical, one cognitive. Measuring both ensures you build platforms that not only run fast, but also think fast.
The Big Lesson
Every millisecond tells a story. Behind each delay is a decision — one that probably felt small at the time. If you want to build truly scalable platforms, don’t just manage code; manage the chain of choices that shape it.
The best platforms aren’t the ones that move the fastest — they’re the ones that stay fast as they grow.
© Arcaence™ — All frameworks and visuals are protected intellectual property. Reuse by permission only.